Get in touch


We use HubSpot CRM to process and manage contact and information requests. Please accept the "Functional Cookies" and reload the page to load the contact form.

Insights / Blog / Agility & Organisation

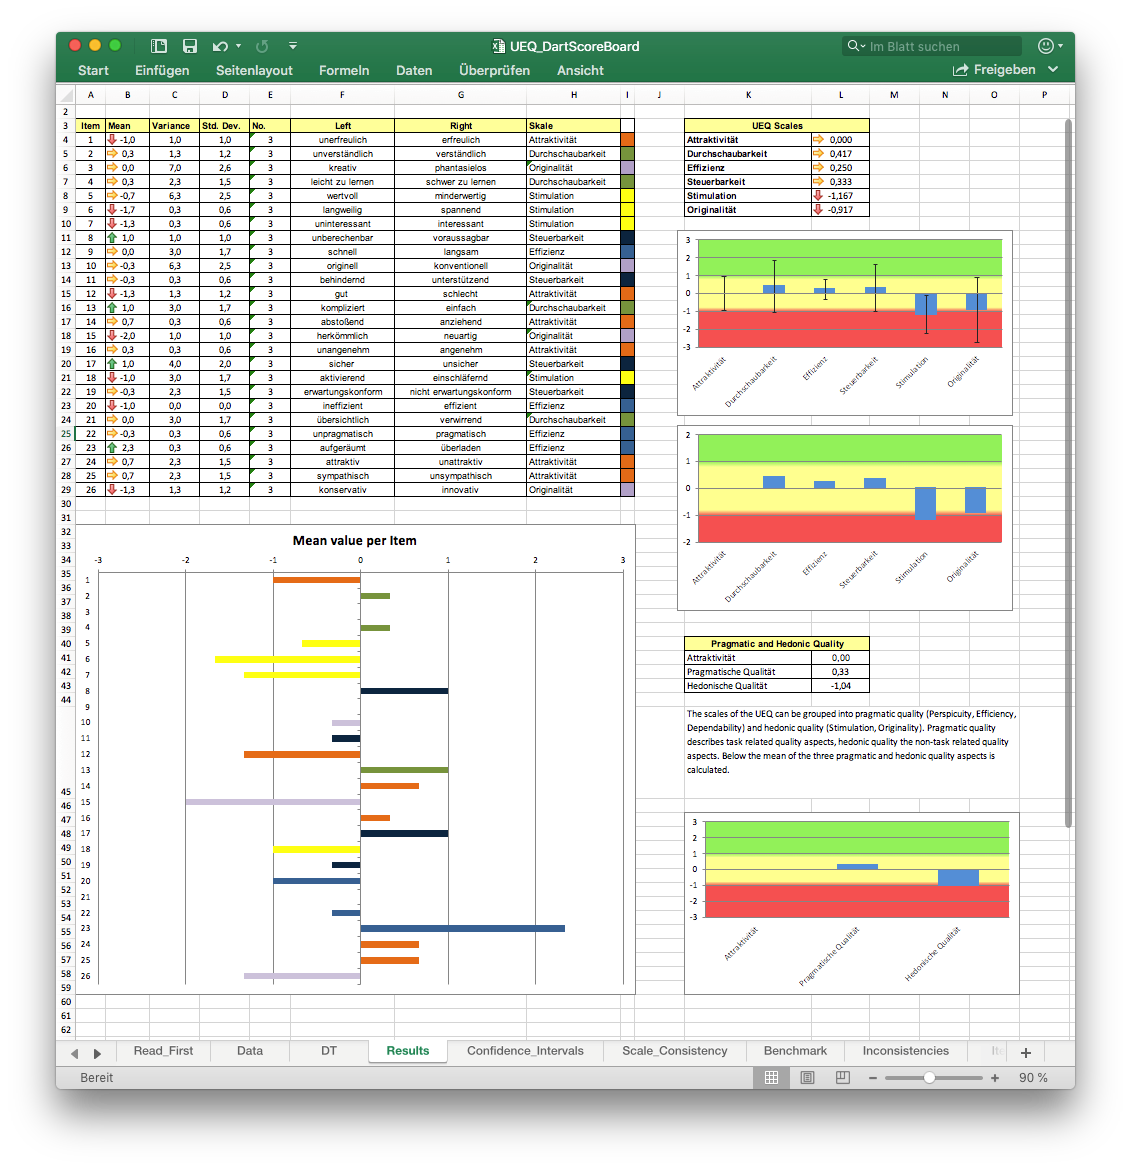
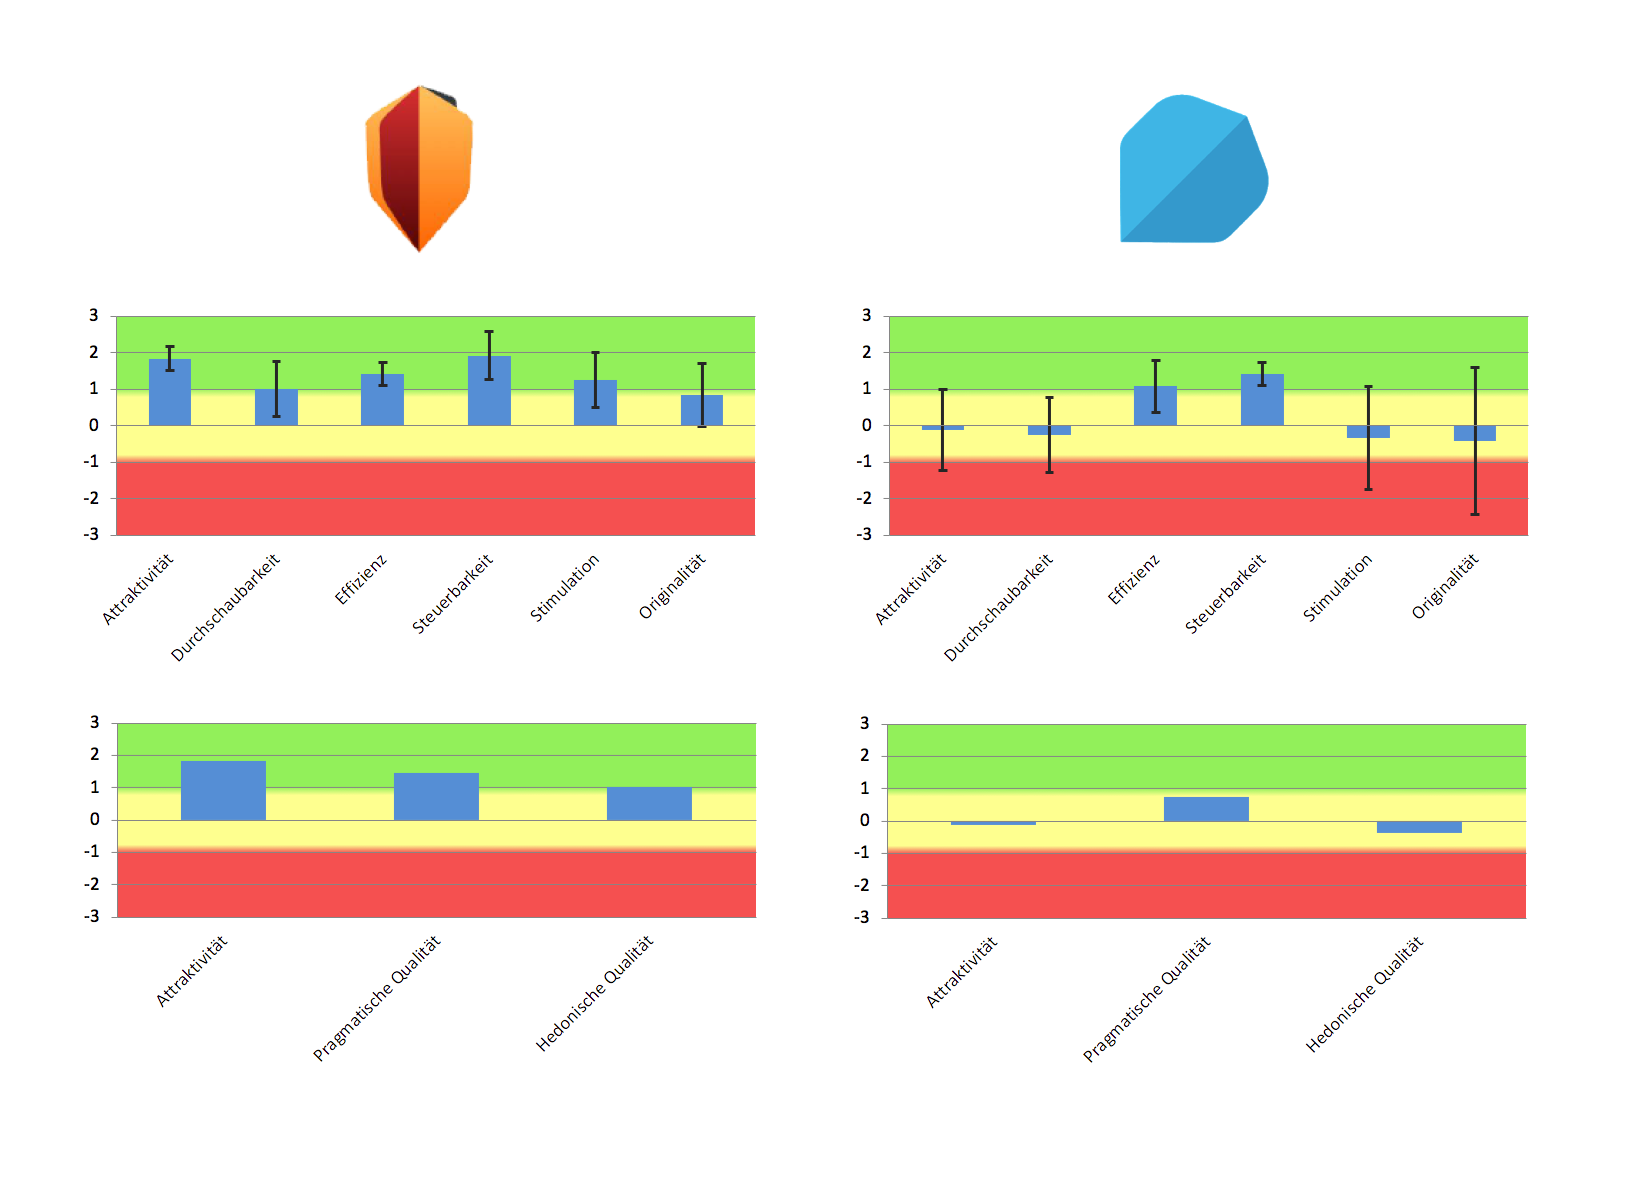
UEQ - User Experience Questionnaire: The UX Testing Tool that was here all this time - for free

October 16, 2018
Author Diana WeschkeDiana WeschkeProduct Owner

Have you ever heard of the User Experience Questionnaire or UEQ? If you have not, you need to download it right now! It allows the evaluation of your product in just 2 minutes, makes it comparable to your competition and let’s you observe your UX over time.

I read articles about UX evaluation methods on a daily basis, collected several UX guides on my desk and get my mailbox cramped by pricey software solutions. But it took me some off-the-job-training as an usability engineer to stumble upon an easy survey which even is scientifically constructed and completely free of charge. I’ve never read anything about the UEQ before this university training, so that’s why I would like to share the experiences I made doing benchmarking and tracking of the user experience over releases.

What’s the UEQ?

In 2006 three German IT and usability experts came together and developed a 2–3 minutes survey to evaluate the UX quality of a product. Although the User Experience Questionnaire was initially intended for the evaluation of software products, it can also be applied to every other kind of product — digital and physical.

It works with semantic differentials — your users basically need to fill out a survey of 26 consisting of 26 contrariant adjective pairs. Those randomly ordered word groups represent six scales which are crucial for good UX (*Those scales combine some of the heuristics for interface design by Nielsen and add with novelty and stimulation more experience-driven items.):

  • Attractiveness
  • Perspicuity
  • Efficiency
  • Dependability
  • Stimulation
  • Novelty

Attractiveness rates the overall aesthetics of an application and how allured users are by it. Perspicuity shows how easy people understand the product and dependability gives an idea about it seeming trustworthy. The joy of use is measured within the stimulation scale and novelty represents how innovative a tool is perceived.

In order to get a broader feeling of your product’s qualities the UEQ provides you a score which rates the overall performance in:

  • Attractiveness
  • Pragmatic Quality
  • Hedonic Quality

Do I need statistic skills?

Well, no… The most wonderful thing about the UEQ is that it comes with an Excel analysis tool. So there’s no need for being a pro in statistics or math.

" You simply enter the answers of your maximum 1000 testers and Excel does the rest — including the visualization."

How does benchmarking with the UEQ work?

For a side project I needed to do some benchmarking on dart score boards — you know, those apps where you can enter your results while playing steel darts so you don’t need to write them down on paper.

I got some of my friends together for a usability test and asked them to play a game of 301 with each of the five apps I chose. During their games I observed and listened to what they have to say about the usability (think aloud method). Thanks to those usability tests I have got quite a few insights on what matters in those kind of apps and saved myself a little bit of work with the feature audit. After every game I gave out the UEQ validation sheets for each app.

As you see there are big differences in how the users rated the apps. Now you can compare those numbers to the design and interpret it. "Dartsmind" got better over all results in every group than any other app I benchmarked. The black lines indicate the maximum and minimum value given and you see all answers, even the relatively low once, are in the positive spectrum.

"Let’s Dart" on the other hand got very mixed reviews. Except from Efficiency and Dependability every other scale is negative. With some products you might not care about the other scales because being efficient and dependable might be the only thing that matters for you. But since we are talking about leisure apps, stimulation and attractiveness should count as well. Also the answers fluctuated dramatically — so it would be interesting to investigate which kind of users rated which scales positive and vice versa.

I just did the benchmarking with three participants. In order to get statistically significant results I would of course need to validate this app with more users again. But even with this fairly small sample it became obvious that "Dartsmind" performs pretty well with regard to the app’s design design since it got all positive values and not too big of a fluctuation in the answers between different users.

How do I track my UX over time with the UEQ?

In a project for one of my clients (a financial institute which is offering funding for businesses) I use the questionnaire to track how the UX changed after a new release. Of course you should not just rely on those numbers and graphs but combine it with usability tests. Anyway, isn’t it nice to see that for example your efficiency or dependability increased after implementing a particular feature? Another case would be to explain the loss of attractiveness of your product with some specific new functionality.

" Doing an UEQ with a bunch of users after every release gives you more certainty about how your new features influence the UX and prove it with cold hard facts!"

These numbers might help with negotiating with more traditional clients over what it is the user needs.

Where do I get the UEQ?

You can download the survey for free and in 20 different languages over here: UEQ Online. They ask for an email address but I didn’t get any spam so far and it downloads immediately afterwards. There were also ideas of even shortening the questionnaire further, so you can use it for example after the check out on your e-commerce page. There’s a paper about that here.

Further reading and more cases studies

There are a few academic publications in the download section on the site that show how you can use the UEQ for usability testing, benchmarking or research.

Looking for more content like this?

We just launched our newsletter "AOE Ping". With AOE Ping, you will no longer miss any insights, news, events and job offers from AOE. In addition, each issue focuses on a specific area of agile software development.

Subscribe to our newsletter